Numerical Results — Lesson 7
Velocity
First, we will look at the velocity vectors of the solution to see if they make intuitive sense. To plot the velocity vectors, go to Results > Graphics and Animations. In the Graphics and Animations Window, select Vectors and click Set Up.... This will bring up the Vectors Menu.

Make sure the settings of the menu match the figure above: namely Vectors of > Velocity, Color by > Velocity, and set the second box as Velocity Magnitude. To see the velocity vectors, press Display.

Pressure Contours
To view the pressure contours over the entire mesh, go to Results > Graphics and Animations again, and in the Graphics and Animations Window, select Contours.
Click Set Up... to bring up the Contours Menu. Check the box next to Filled. Under Contours Of, ensure that the two boxes that are selected are Pressure... and Static Pressure.

Once these parameters are set, press Display to see the pressure contours.
Streamlines
To view the streamlines, keep the Contours window open, and change the Contours Of box to Velocity, and the box below to Stream Function. Change Levels to 100. Also, uncheck the box marked Auto Range, and set Min(kg/s) to 13.11, and Max(kg/s) to 14.16.

To view the streamlines, press Display

Pressure Coefficient
Next, we will plot the pressure coefficient along the surface of the airfoil. Click on Results > Plots to open the Plots Window. Under Plots, select XY Plot, and click Set Up.... In the window that pops up, change the settings Y-Axis Function > Pressure, and change the second box to Pressure Coefficient. Ensure X-Axis Function > Direction Vector. Under Surfaces, select airfoil. See the figure below for help.
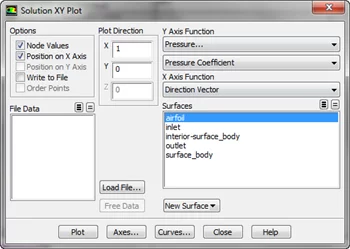
When all the settings are correct, press Plot to plot the data to the command window. To save the data to a text file, check the box next to Write to File. You'll notice that the Plot button has been replaced by a button marked Write.... Click it. Change the file type to All Files and save the file name as Pressure_Coefficient.txt.
Coefficients of Lift and Drag
To find the Coefficients of Lift and Drag, click Results > Reports to bring up the Reports Window. In the Reports Window, select Forces and click Set Up.... This will bring up the Force Reports menu.

We need to set the parameters so drag across the airfoil (keep in mind, which is at an angle) will be displayed. In the Force Reports window change the Direction Vector such that X > .9945 and Y > .1045. Click Print to print the drag coefficient to the command window. To print the lift coefficient, in the Force Reports window change the Direction Vector such that X > -.1045 and Y > .9945. Again, press Print.
You are being redirected to our marketplace website to provide you an optimal buying experience. Please refer to our FAQ page for more details. Click the button below to proceed further.