Numerical Results — Lesson 7
Velocity
First, we will look at the velocity vectors of the solution to see if the make intuitive sense. To plot the velocity vectors, go to Results > Graphics and Animations. In the Graphics and Animations Window, select Vectors and click Set Up. This will bring up the Vectors Menu.
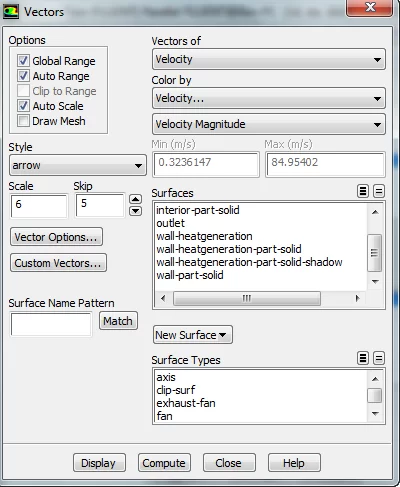
Make sure the settings of the menu match the figure above namely Vectors of > Velocity, Color by > Velocity, and set the second box as Velocity Magnitude. To see the velocity vectors, press Display.

Temperature Contours
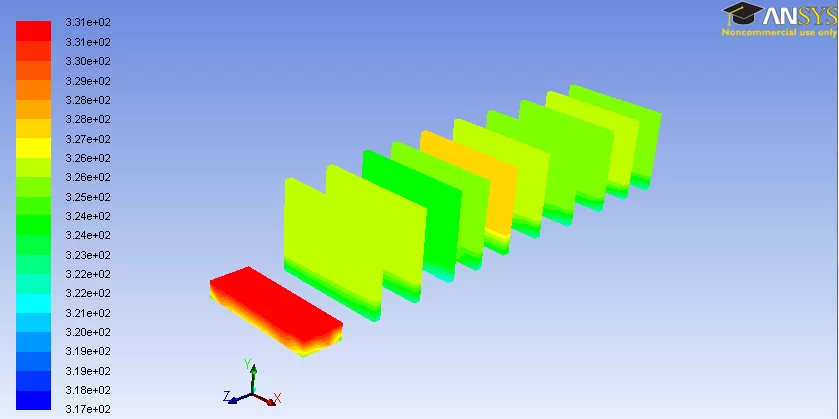
To view the pressure contours over the entire mesh, go to Results > Graphics and Animations again, and in the Graphics and Animations Window, select Contours.
Click Set Up. to bring up the Contours Menu. Check the box next to Filled. Under Contours Of, ensure that the two boxes that are selected are Temperature. and Static Temperature. Select the wall-heatgeneration-part-solid in the surfaces window.

Once these parameters are set, press Display to see the temperature contours.
You are being redirected to our marketplace website to provide you an optimal buying experience. Please refer to our FAQ page for more details. Click the button below to proceed further.